
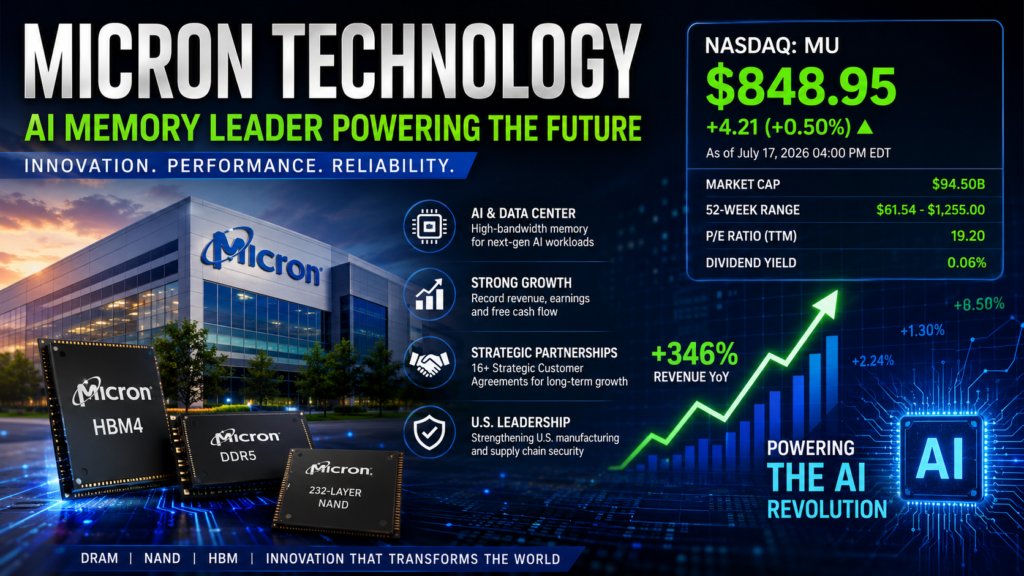
Live Market Snapshot
Market Sentiment: Cautious. The Philadelphia Semiconductor Index has shed more than 11% from its June record high. Micron is notably failing to participate in sector rebounds, suggesting company-specific overhangs beyond just macro sentiment.
Risk Appetite: Rotating. Institutional investors are trimming semiconductor exposure. Short interest in Micron has surged to three-year highs, reflecting a meaningful build-up of bearish positioning.
Sector Positioning: The memory chip space is caught between record fundamentals and valuation concerns. UBS projects total memory industry revenues reaching $992 billion in 2026 and $1.76 trillion in 2027. The DRAM industry is expected to remain structurally undersupplied through at least 2028.
The Setup: What’s Actually Happening With MU?
Let’s cut through the noise.
Micron Technology (NASDAQ: MU) closed at $848.95 on July 17, 2026 — down 0.50% on the day, off 32% from its 52-week high of $1,255 set on June 25, and now trading below its 20-day moving average of $1,023.
The stock has been hammered. But here’s the paradox: the company just posted the best quarter in its history.
Revenue hit $41.46 billion — up 346% year-over-year and 74% sequentially. Non-GAAP EPS came in at $25.11, up 1,398% year-over-year. Gross margins hit 84.9%. Operating cash flow reached $25.39 billion. Free cash flow hit a record $18.3 billion.
So why is the stock down?
Because markets don’t trade on what happened. They trade on what happens next.
The Earnings That Changed Everything
Let’s be specific about what Micron reported on June 24, 2026:
| Metric | Q3 FY2026 | Q2 FY2026 | Q3 FY2025 | YoY Change |
|---|---|---|---|---|
| Revenue | $41.46B | $23.86B | $9.30B | +346% |
| GAAP Net Income | $28.24B | $13.79B | $1.89B | +1,398% |
| Non-GAAP EPS | $25.11 | $12.20 | $1.91 | +1,215% |
| Gross Margin | 84.9% | 74.9% | 39.0% | +45.9pp |
| Operating Income | $33.68B | $16.46B | $2.49B | +1,253% |
| Operating Cash Flow | $25.39B | $11.90B | $4.61B | +451% |
| Free Cash Flow | $18.3B | — | — | Record |
Source: Micron Technology Q3 FY2026 Earnings Release
The company also signed 16 Strategic Customer Agreements (SCAs) — multi-year, take-or-pay contracts covering a significant portion of its revenue and providing pricing stability that the memory industry has never seen before.
HBM supply for calendar 2026 is fully contracted. The company has also presold its complete production capacity through 2027. HBM4 is already shipping ahead of schedule, with the HBM total addressable market expected to reach $100 billion by 2028 — two years ahead of prior forecasts.
For Q4 FY2026, management guided to:
- Revenue: $50B ± $1B
- EPS: $31 ± $1
That’s not a slowdown. That’s acceleration.
The Valuation Question: Cheap or Expensive?
Here’s where it gets interesting — and where most analysis goes wrong.
| Metric | Value |
|---|---|
| Trailing P/E | ~19.2 |
| Forward P/E (FY2026 est.) | ~11.6 |
| Forward P/E (FY2027 est.) | ~5.6 |
| Sector Average P/E | ~23.2 |
| Beta | 1.88 |
| Dividend Yield | 0.06% |
On a forward basis, Micron trades at a significant discount to the sector. But here’s the catch: forward P/E is only as good as the earnings forecast it’s based on. Analysts are projecting $73.39 EPS for fiscal 2026 and $150.77 for fiscal 2027.
If those numbers materialize, MU is absurdly cheap. If they don’t, the stock is priced for perfection.
A ~5.6 forward P/E for a company growing revenue 346% is not normal. It suggests the market doesn’t believe the earnings are sustainable.
Why Is Micron Falling? (The Real Answer)
The selloff isn’t about Micron. It’s about what the market thinks comes next.
1. Peak Cycle Fears
Semiconductors are cyclical. Always have been. Always will be. The question isn’t whether the cycle will turn — it’s when. Memory prices have surged. Supply is tight. But SK Hynix and Samsung are spending $575 billion on new facilities. When that capacity comes online, pricing pressure follows.
2. AI Capex Growth Moderation
While AI infrastructure spending remains strong, the growth rate is expected to moderate. UBS projects hyperscaler capex growth slowing from current torrid levels.
3. China Competition
Chinese memory chip makers are increasing production, potentially intensifying competition in DRAM and NAND markets.
4. Crowded Trade Unwind
The semiconductor trade became crowded. When crowded trades unwind, they unwind hard — regardless of fundamentals.
5. Insider Selling at Record Pace
Micron insiders have sold more than $100 million in shares over the past 24 months — the highest rate of insider selling since 2010. CEO Sanjay Mehrotra sold 4,000 shares on June 26, raising over $46 million. Director Lynn Dugle sold 1,300 shares for $1.5 million.
6. Short Interest at Three-Year Highs
Short interest in Micron has surged to three-year highs, reflecting meaningful bearish positioning. As of July 10, short interest stood at 31.67 million shares, down 23.86% from the prior period.
What Could Go Wrong? (The Contrarian Section)
Let’s be real about the risks — because most coverage glosses over them.
The Semiconductor Cycle Is Still Real
Micron’s 84.9% gross margins are historically anomalous. In a normal DRAM cycle, margins average 30-50%. The current environment is driven by AI-driven supply constraints. When supply catches up — and it will — margins compress.
The Competition Is Spending Big
Samsung and SK Hynix control 47% of the NAND market. Micron controls 22% of DRAM and 13% of NAND. SK Hynix held 56-58% of the HBM market in Q1 2026, with Samsung and Micron roughly tied for second at about 21-22% each. SK Hynix’s $26.5 billion Nasdaq debut on July 10, 2026 — the largest U.S. listing ever by a foreign company — underscores the competitive intensity.
The Valuation Is Priced for Perfection
At $848.95, the stock implies that FY2026 EPS of $73 is achievable and sustainable. If EPS comes in at $50 instead of $73 — still an outstanding result — the forward P/E jumps to 17. That’s not expensive, but it’s not the bargain it appears to be today.
Retail Speculation
MU has been one of the most talked-about stocks on retail platforms. Trading near 170% year-to-date gains as of mid-July, the 32% drawdown from the peak has already shaken out weaker hands.
Three Scenarios: Bull, Base, Bear
Bull Case (Probability: 25%)
AI memory demand continues to outstrip supply through 2027 and beyond. HBM becomes the new standard for AI infrastructure. Micron’s SCAs provide pricing stability that breaks the historic memory cycle. EPS hits $150+ by FY2027. The stock re-rates to a 15x forward P/E.
Price target: $1,800 – $2,200
Key catalysts: HBM4 adoption accelerates; hyperscaler capex remains elevated; supply constraints persist
Base Case (Probability: 50%)
The cycle peaks in 2027 but doesn’t crash. EPS settles around $100-120 in FY2027. The stock trades at 10-12x forward earnings. The AI memory market grows but at a more measured pace.
Price target: $1,200 – $1,500
Key drivers: Balanced supply-demand; steady AI adoption; margin normalization
Bear Case (Probability: 25%)
Chinese competition intensifies. Samsung and SK Hynix flood the market with capacity. AI capex slows more than expected. EPS falls to $50-70. The stock re-rates to 8-10x.
Price target: $500 – $700
Key risks: Capacity oversupply; demand shock; margin compression
Analyst Targets: What Wall Street Is Saying
According to 45 analysts polled by S&P Global, Micron stock has a consensus rating of “Strong Buy” and an average price target of $1,486 — implying 75% upside from current prices. The lowest target is $361 (-57.48%) and the highest is $2,200 (+159.14%).
| Firm | Rating | Price Target | Date |
|---|---|---|---|
| Cantor Fitzgerald | Overweight | $2,000 | Jun 29, 2026 |
| KeyBanc | Overweight | $1,750 | Jul 14, 2026 |
| HSBC | Buy | $1,700 | Jun 25, 2026 |
| TD Cowen | Buy | $1,600 | Jul 10, 2026 |
| Bank of America | Buy | $1,550 | Jul 6, 2026 |
| J.P. Morgan | Buy | $1,540 | Jul 10, 2026 |
| DBS | Buy | $1,400 | Jun 30, 2026 |
| Bernstein | Buy | $1,300 | Jul 6, 2026 |
Average price target: $1,486
Median price target: $1,600
But here’s the dirty secret: analysts are playing catch-up. In April 2026, the average target was around $306. Targets have been raised aggressively after the stock ran up. These aren’t forward-looking calls — they’re reaction functions.
Insider Activity: Follow the Smart Money
| Metric | Value |
|---|---|
| Insider Sales (6 months) | 187 transactions |
| Insider Sales Value (6 months) | ~$209.8M |
| Insider Purchases (6 months) | 3 transactions |
| Insider Purchase Value | ~$7.8M |
| Insider Sentiment | Mixed, sale-heavy |
Notable insider sales:
- CEO Sanjay Mehrotra sold 4,000 shares on June 26, 2026 — over $46 million
- EVP April S. Arnzen sold 40,000 shares on July 1, 2026
- Director Lynn Dugle sold 1,300 shares for ~$1.5 million
Institutional ownership: 80.84%
Largest institutional holder: Vanguard Group Inc. (6.48%)
What the insider activity tells us: The combination of insider selling at the highest rate since 2010 and short interest at three-year highs is more informative than either data point alone. Insiders and shorts rarely move in lockstep for the same reason; when they do, it’s worth asking what both groups might be seeing that the bulls are discounting.
Institutional Positioning: Follow the Money
Institutional ownership: 80.84% of MU shares
Notable moves:
- Hodges Capital Management cut its Micron stake by 31.4% in Q1 2026
- Vanguard Group Inc. is the largest institutional holder with 6.48%
ETF exposure:
- 8.03% of iShares Semiconductor ETF (SOXX)
- 8.39% of Invesco S&P 500 Momentum ETF (SPMO)
- 9.78% of Invesco PHLX Semiconductor ETF (SOXQ)
Technical Analysis: Where’s the Support?
| Level | Price |
|---|---|
| Current Price | $848.95 |
| 20-day SMA | ~$1,023 |
| 50-day SMA | ~$916.74 |
| 200-day SMA | ~$472.44 |
| Key Resistance | $1,089.50 |
| Key Support | $891.50 |
| Key Swing Zone | $818.67 – $860.68 |
| RSI | 50.12 (neutral) |
Micron is trading about 7.3% below its 20-day SMA but remains 6.2% above its 50-day SMA and more than 100% above its 200-day SMA. The RSI reading of 50.12 suggests the stock has cooled from previously overbought levels and is now consolidating.
Competitive Comparison: How MU Stacks Up
| Company | DRAM Market Share | HBM Market Share | Forward P/E | Geopolitical Advantage |
|---|---|---|---|---|
| Samsung | 38% | ~21-22% | ~— | Limited (Korean) |
| SK Hynix | 29% | 56-58% | ~5.8x | Limited (Korean) |
| Micron | 22% | ~21-22% | ~7x | Strong (U.S.) |
Source: Counterpoint Research, Investing.com analysis
Micron commands a valuation premium over SK Hynix even though it is a significantly smaller player by HBM share. Several structural factors explain the gap:
- U.S. domicile — geopolitical tailwind in an era of export controls
- $250 billion+ U.S. investment plan through 2035
- SCAs providing revenue visibility competitors lack
The Bigger Picture: What This Cycle Means
Micron isn’t just a memory company anymore. It’s an AI infrastructure company. The distinction matters.
Traditional memory cycles were driven by PC and smartphone demand — stable, predictable, and slow-growing. AI memory demand is different. It’s driven by training clusters, inference servers, and data center buildouts. It’s lumpy, concentrated, and fast-growing.
The 16 SCAs Micron has signed cover long-term agreements with some of its largest customers, creating more predictable demand and pricing over the next three to five years. That’s new. That’s structural. It changes the earnings profile.
But it doesn’t eliminate the cycle. It just changes the shape of it.
Portfolio Strategy: How to Think About MU
This isn’t a recommendation — it’s a framework.
If you’re a long-term investor (3-5 years):
- The AI memory trend is real. HBM demand is contracted through 2026 and presold through 2027. SCAs provide revenue visibility.
- Dollar-cost average into weakness. The 32% drawdown from the peak is the first real pullback in this cycle.
- Position size matters. Don’t bet the farm on any single name.
If you’re a trader (weeks to months):
- Volatility is your friend and enemy. The stock moves 5-10% on headline risk.
- Watch hyperscaler capex announcements. Watch memory pricing data. Watch competitor capacity announcements.
- The $804 low from July 17 is a technical level to watch.
Risk management:
- This is a cyclical stock with a beta of 1.88.
- Position accordingly. Use stop losses if you’re trading. Size appropriately if you’re investing.
The Bottom Line
Micron is the most debated stock in semis for a reason.
The fundamentals are extraordinary. The valuation (on forward earnings) is cheap. The AI memory market is real and growing. The SCAs provide visibility the company has never had before.
But the risks are equally real. The cycle will turn. Competition is spending $575 billion. AI capex will eventually moderate. Insiders are selling at the fastest pace since 2010. Short interest is at three-year highs.
The bull case is simple: Micron is becoming a higher-quality, less-cyclical AI infrastructure company. The SCAs prove it. The HBM contracts prove it. The earnings prove it.
The bear case is simple: The cycle always turns. 84.9% gross margins are unsustainable. Competition will erode pricing. AI capex will slow. The stock is priced for perfection.
Both cases are plausible. The truth will depend on whether Micron can sustain these margins when capacity comes online.
FAQ
1. Is Micron Technology a good stock to buy in 2026?
Answer: Analysts have a “Strong Buy” consensus on MU with a $1,486 average price target, implying 75% upside. However, the stock is volatile (beta 1.88) and semiconductor cycles pose real risks. Investors should size positions appropriately and consider dollar-cost averaging into weakness.
2. Why is Micron stock falling?
Answer: MU is down 32% from its June peak due to fears of an AI capex slowdown, Chinese competition, a crowded trade unwind in semiconductors, record insider selling, and short interest at three-year highs. The selloff is sector-wide, not company-specific, despite Micron posting record earnings.
3. What is Micron Technology’s stock symbol?
Answer: MU is the ticker symbol for Micron Technology, Inc. on the NASDAQ exchange.
4. What is the price target for Micron Technology stock?
Answer: The average 12-month price target is $1,486, with a high of $2,200 (Cantor Fitzgerald) and a low of $361. 45 analysts polled by S&P Global rate MU a “Strong Buy”.
5. What kind of stock is Micron Technology?
Answer: Micron is a semiconductor stock specializing in memory and storage solutions, including DRAM, NAND flash, and high-bandwidth memory (HBM) for AI applications. It’s the third-largest DRAM player globally with 22% market share.
6. Is Micron overvalued?
Answer: On a trailing basis, MU trades at a P/E of ~19.2, below the S&P 500. On a forward basis (~5.6-11.6x), it’s significantly below the sector average. The stock appears cheap relative to projected earnings, but those projections assume sustained AI demand.
7. What are the risks of buying Micron stock?
Answer: Key risks include: semiconductor cyclicality, competition from Samsung and SK Hynix ($575 billion in combined spending), potential AI capex slowdown, Chinese memory production, margin compression when supply catches up with demand, record insider selling, and elevated short interest.
Key Takeaways
- MU closed at $848.95 on July 17, 2026 — down 32% from its $1,255 peak but with a $1,486 average analyst target.
- Q3 FY2026 was historic: $41.46B revenue (+346% YoY), $25.11 EPS, 84.9% gross margins, $18.3B free cash flow.
- 16 Strategic Customer Agreements provide revenue visibility and margin stability the company has never had before.
- HBM supply through 2026 is fully contracted and production through 2027 is presold.
- The risks are real: cycle peak fears, $575B competitor spending, AI capex moderation, record insider selling since 2010, and three-year high short interest.
- Valuation is cheap on forward earnings (~5.6-11.6x) but the market doesn’t believe the earnings are sustainable.
- Three scenarios: Bull ($1,800-2,200), Base ($1,200-1,500), Bear ($500-700) — with the Base Case most likely.
Disclaimer: This article is for informational and educational purposes only. It does not constitute financial advice. Past performance is not indicative of future results. Always do your own research and consult with a qualified financial advisor before making investment decisions.
Related reading: ASTS Stock Analysis 2026 | NBIS Stock Analysis 2026 | VRT Stock Analysis 2026 | HOOD Stock Earnings 2026 | Software Stocks 2026 | Why Are Stocks Down Today | Tech Stocks 2026 | What is S&P 500 | TSLA Stock Analysis | How to Choose Your First Stocks | Trading vs Investing | Investing for Beginners | Stock Market Analysis for Long-Term Investors | Rivian Stock Forecast 2026 | Netflix Stock Forecast 2026 | Anthropic Stock IPO Status | Is Gold Bullion a Good Investment | Gold vs Silver | NVDA Stock Analysis | Palantir Stock Price | 7 Semiconductor Stocks Under $50 | Best EV Stocks Under $20 | AI Infrastructure Stocks 2026 | Stocks That Could 10x by 2030 | Undervalued Semiconductor Stocks 2026 | Scale AI Stock Analysis | Best Semiconductor Stocks for Growth | Most Overvalued Semiconductor Stocks | Real Estate Investment Advice | M Stock | VMware Stock Price | Suzlon Energy Share Price | MULN Stock Analysis | IDEA Share Price | Special Investment Region | Advantages of Long-Term Investing | Alphabet Stock | Microsoft Stock | Apple Stock | Amazon Stock | xAI Stock | TSMC Stock Analysis | SPCX Stock Analysis | Broadcom Stock | Meta Stock Analysis