
By [Shourya Singh] – Financial Analyst, MoneyMint
12+ years covering technology stocks, AI infrastructure, and global equity markets
[LinkedIn Profile Link] | [Previous Analysis: NVDA, TSLA, MSFT]
Amazon Stock: The Setup
Here’s the thing about Amazon (NASDAQ: AMZN) that nobody wants to say out loud: the stock is up only about 6% year-to-date in 2026 while the S&P 500 is up roughly 10%. For a company that just posted its highest-ever operating margin (13.1%) and its fastest AWS growth in 15 quarters, that’s peculiar.
But here’s what’s actually happening: Amazon is in the middle of the largest infrastructure build-out in corporate history—roughly $200 billion in capital expenditures in 2026. The market doesn’t know whether to celebrate the future or punish the present.
I’ve been through enough market cycles to recognize this pattern. When a quality company spends aggressively on capacity while the stock stagnates, you’re either early to a generational opportunity or you’re catching a falling knife. The difference is in the details.
Let’s cut through the noise.
Live Market Snapshot
Current Market Context (July 2026): The broader market is digesting mega-cap AI spending with a mix of enthusiasm and skepticism. The VIX remains elevated as investors rotate between AI winners and laggards. Amazon sits firmly in the “laggard” camp year-to-date despite fundamentally stronger operations—a disconnect that typically resolves one way or the other with volatility.
Sector Positioning: Tech is still the dominant narrative, but the “Magnificent Seven” trade has fragmented. Amazon is now one of the worst performers among the group over recent periods. That’s not necessarily a sell signal—it’s often where contrarian money starts looking.
The Numbers That Actually Matter
Amazon Stock Price & Key Metrics
| Metric | Value |
|---|---|
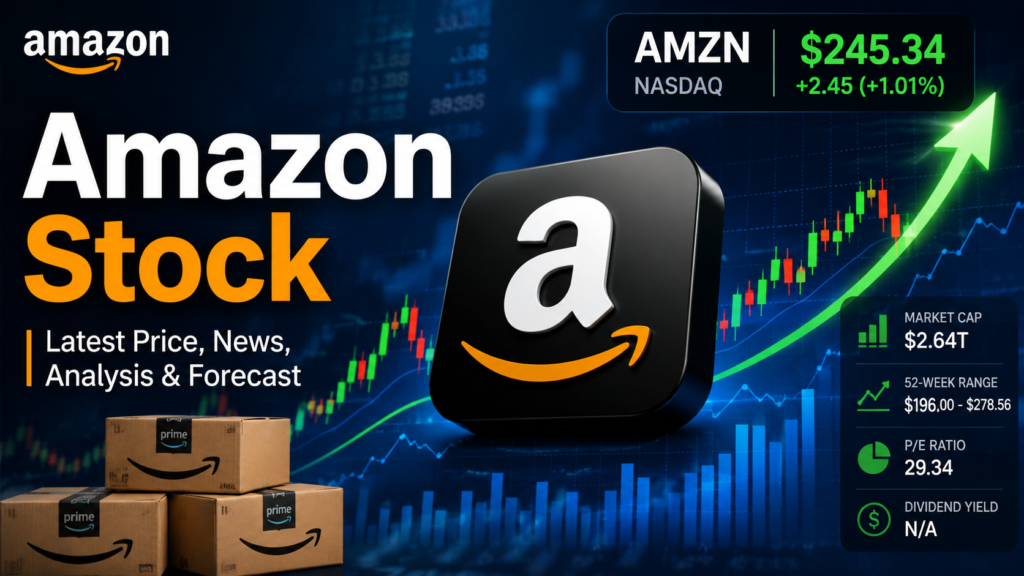
| Current Price | $245.34 (July 10 close) |
| After-Hours | $245.74 (+0.16%) |
| Market Cap | $2.64 trillion |
| 52-Week Range | $196.00 – $278.56 |
| Trailing P/E | ~29x |
| Beta | 1.46 |
| Shares Outstanding | ~10.76 billion |
| Institutional Ownership | 72.20% |
The stock currently sits roughly 12% below its 52-week high of $278.56. At ~29 times earnings, Amazon isn’t “cheap” by traditional value metrics—but it’s trading at a significant discount to its own historical average.
That doesn’t mean the stock is cheap. It means the market is pricing in something—and that something is the $200 billion question.
The $200 Billion Question: AI Infrastructure or Overreach?
Amazon plans to spend roughly $200 billion on capital expenditures in 2026, with the bulk earmarked for AWS data centers, networking infrastructure, and proprietary silicon. To put that in perspective:
- 2025 capex was ~$131 billion
- 2026 capex is a ~54% year-over-year increase
- Q1 2026 cash capex alone hit $43.2 billion
- Q1 2026 total capex reached $44.2 billion
Goldman Sachs now expects cumulative capex of ~$827 billion from 2026 through 2028. That’s not a rounding error—that’s nearly a trillion dollars of capital deployment in three years.
Here’s where the market narrative gets interesting. The initial reaction to this spending was fear—the stock dropped to around $198 when the plan was announced in February. But Q1 earnings changed the conversation.
What Q1 2026 Actually Told Us
Amazon delivered:
- EPS of $2.78 vs. consensus of $1.64 (a ~70% beat)
- Revenue of $181.5 billion, up 17% year-over-year
- Operating margin of 13.1%—an all-time record
- AWS revenue of $37.6 billion, up 28%—fastest pace in 15 quarters
- AWS operating income of $14.2 billion at a 37.7% operating margin
The bear narrative was that massive AI spending would crush margins and free cash flow. The Q1 data challenged that directly. Margins expanded to record highs while spending accelerated.
The Custom Silicon Edge
This is where the story gets technical—and where most retail analysis stops short. Amazon’s custom chip strategy is becoming a genuine financial differentiator:
- Trainium2 is largely sold out; Trainium3 is nearly fully subscribed
- Custom silicon business (Trainium, Graviton, Nitro) crossed a $20 billion annual revenue run rate with triple-digit growth
- OpenAI committed to ~2 gigawatts of Trainium capacity starting 2027
- Anthropic committed to as much as 5 GW
- CEO Andy Jassy said the chip business could eventually generate $50 billion in annual revenue
CEO Andy Jassy stated that Trainium at scale will provide “several hundred basis points of operating margin advantage” by replacing Nvidia GPUs with lower-cost in-house alternatives.
This is the bull case in a nutshell: Amazon is building its own chip empire while everyone else is paying Nvidia’s tolls.
Analyst Consensus: What Wall Street Is Actually Saying
According to analysts polled, Amazon stock earns a “Strong Buy” consensus rating based on 57 Buy ratings versus three Holds. The average 12-month price target is $312.79—implying ~27.5% upside from current levels.
| Analyst | Firm | Rating | Price Target | Upside |
|---|---|---|---|---|
| Eric Sheridan | Goldman Sachs | Buy | $335 | +36.6% |
| — | TD Cowen | Buy | $340 | +38.6% |
| — | BofA Securities | Buy | $310 | +26.4% |
| — | Needham | Buy | $300 | +22.3% |
| — | Stifel Nicolaus | Buy | $319 | +30.0% |
Goldman Sachs (July 9, 2026) raised its target from $325 to $335, switching to a sum-of-the-parts (SOTP) valuation method. The firm expects AWS revenue to grow ~33% in 2026 and ~35% in 2027. Goldman also concluded that Amazon’s recent bond issuance and ongoing access to debt markets are “very likely sufficient” to cover any funding gaps.
The Bear Case: What Could Go Wrong
Let me be direct about the risks, because anyone who tells you Amazon is a sure thing either hasn’t been through a market downturn or is selling you something.
1. The Free Cash Flow Crisis
This is the single biggest risk. Trailing free cash flow collapsed 95% to $1.2 billion in Q1 2026 as capex hit $44.2 billion. Quarterly free cash flow went to minus $17.2 billion.
Wall Street analysts project that Amazon could face an estimated $40 billion negative free cash flow deficit annually in 2026 and 2027. Goldman Sachs explicitly models a ~$70 billion free cash flow gap in 2027/2028. The firm’s conclusion? Amazon’s recent bond issuance and ongoing access to debt markets can cover it.
But here’s the uncomfortable question: What if the debt markets tighten?
Amazon’s July 2026 bond offering—an eight-tranche, $25 billion sale—generated $62 billion in peak demand. That sounds strong until you compare it to the $37 billion debt offering in March. The subscription ratio weakened. Fixed-income investors are becoming more selective.
Amazon raised $25 billion in July and signaled to underwriters that this concludes all debt issuance for the 2026 calendar year. That’s a defined boundary—but it also means no more bond market backstop until 2027 if things get ugly.
2. Regulatory Overhang
Amazon is heading into a possible third regulatory front in just a few years, alongside an antitrust trial over marketplace pricing expected in early 2027. The FTC secured a $2.5 billion settlement in September 2025 over Prime enrollment practices. These aren’t existential threats, but they’re persistent headwinds that limit multiple expansion.
3. The Tariff Question
CEO Andy Jassy acknowledged that 2026 could be a challenging year for the business due to tariffs. Every retailer faces this, but Amazon’s retail segment—still the largest revenue contributor—is disproportionately exposed.
4. Competition Intensifying
Intensifying e-commerce competition is eroding market share and margins. Walmart, Target, and a host of specialized e-commerce players are not standing still. Meanwhile, in cloud, Microsoft Azure and Google Cloud are investing aggressively—though neither matches Amazon’s AI data center capacity additions.
5. Historical Drawdown Risk
Looking at Amazon’s risk during major market sell-offs:
- Dot-Com Crash: -94%
- Financial Crisis: -65%
- Inflation Shock: -56%
Source: Trefis
Amazon is a high-beta stock (1.46). When markets correct, it corrects harder. If we enter a sustained bear market, AMZN could easily revisit the $196 low from earlier this year—or go lower.
Amazon Stock: Three Scenarios for 2026–2030
Bull Case: The AI Winner (Probability: 35%)
AWS accelerates above 30% growth as AI workloads migrate to Trainium chips. Custom silicon delivers the promised hundreds of basis points of margin advantage. The $364 billion AWS backlog converts to revenue. Free cash flow inflects positively by 2028 as capex normalizes. The stock re-rates toward historical averages—$350–$400 by 2028.
Key catalysts: Q2 earnings beat (July 30), Trainium3 shipping, AI workload migration accelerating.
Base Case: Steady Growth (Probability: 50%)
Amazon executes on its plan but faces near-term free cash flow pressure that keeps the stock range-bound. AWS grows 25–28%, retail margins improve gradually, and AI investment pays off over a longer horizon. The stock trades between $280–$330 over 12–24 months—decent returns but not life-changing.
Key catalysts: Gradual AWS backlog conversion, retail margin expansion, capex moderation in 2028.
Bear Case: The Overreach (Probability: 15%)
The $200 billion bet fails to generate adequate returns as AI demand softens or competition intensifies. Free cash flow remains deeply negative, forcing equity dilution or distressed debt issuance. Regulatory action accelerates. The stock drops to $180–$200 or lower, consistent with historical drawdown patterns during market stress.
Key catalysts: Q2 earnings miss, capex guidance increase, macro downturn, regulatory escalation.
Comparative Valuation: How Amazon Stacks Up
| Company | Market Cap | Trailing P/E | Revenue Growth (Q1) | Cloud/AI Exposure |
|---|---|---|---|---|
| Amazon | ~$2.64T | ~29x | 17% | ~20% of revenue |
| Microsoft | ~$3.1T | ~35x | ~15% | ~25% of revenue |
| Alphabet | ~$2.2T | ~24x | ~13% | ~10% of revenue |
| Meta | ~$1.3T | ~28x | ~18% | Minimal |
Amazon trades at a discount to Microsoft on a P/E basis despite faster revenue growth and a more aggressive AI infrastructure position. That discount reflects the market’s skepticism about the capex cycle. If the AI bet pays off, the discount narrows—and that’s where the upside comes from.
Technical Picture: Where the Chart Stands
- 50-Day Moving Average: ~$254
- 200-Day Moving Average: ~$233
- RSI: ~51 (neutral)
- Short Interest: ~0.92% of float
The stock is trading below its 50-day moving average but above the 200-day. That’s a neutral-to-bearish short-term setup but a bullish long-term structure. Key resistance sits around $247–$254; breaking above that zone would provide technical confirmation of a trend reversal. Support is around $227–$230; a break below could accelerate selling.
My take on the technicals: The chart is consolidating after a sharp correction from $278.56. This is typical behavior for a stock digesting major capital allocation news. The direction of the next breakout will likely be determined by Q2 earnings—not by chart patterns.
Portfolio Strategy: How to Think About Amazon in 2026
What I’m Watching
- July 30, 2026—Q2 earnings. This is the single most important catalyst. The market expects ~$196.8 billion in revenue and ~$1.81 EPS. But the whisper number is higher. AWS growth, capex guidance, and commentary on Trainium adoption will move the stock more than the headline numbers.
- Free cash flow trajectory. The market will forgive negative FCF if the revenue backlog converts. It will punish negative FCF if it doesn’t.
- Trainium adoption. Watch for announcements from major customers. OpenAI, Anthropic, and Meta are already committed. More names = more validation.
Position Sizing Considerations
- Large-cap core position: 5–15% of portfolio for most investors
- High-conviction investors: 15–25% with clear exit strategy
- Conservative investors: Wait for post-earnings clarity
Risk Management
- Set a stop below the 200-day MA (~$233) if you’re trading it
- Dollar-cost average if you’re investing long-term—the volatility is your friend, not your enemy
- Don’t bet the farm on the AI thesis. Amazon is one of the highest-quality businesses on earth, but it’s still a single stock.
Frequently Asked Questions
1. Is Amazon stock a buy in 2026?
Answer: The consensus among analysts is “Strong Buy” with an average price target of $312.79, implying ~27.5% upside. However, the stock faces near-term free cash flow pressure from ~$200 billion in 2026 capex. The decision depends on your time horizon—long-term investors may find value, but traders should wait for Q2 earnings clarity on July 30.
2. What is Amazon’s stock symbol?
Answer: The ticker symbol is AMZN, and it trades on the NASDAQ exchange.
3. How much common stock does Amazon have?
Answer: Amazon has ~10.76 billion shares outstanding.
4. Is Amazon listed on NSE or BSE?
Answer: No. Amazon is listed on the NASDAQ in the United States. It does not have a direct listing on the National Stock Exchange (NSE) or Bombay Stock Exchange (BSE) in India. Indian investors can access AMZN through U.S. brokerage accounts or Indian mutual funds with U.S. exposure.
5. What is the Amazon stock price target?
Answer: The average 12-month price target is $312.79, with a range of targets from various analysts. Goldman Sachs recently raised its target to $335.
6. What is the Amazon stock prediction for 2026?
Answer: Analysts expect $312.79 in 12 months. Goldman Sachs projects AWS revenue growth of ~33% in 2026, with the stock potentially reaching $335. However, near-term volatility is likely given the $200 billion capex program.
7. What are the risks of buying Amazon stock now?
Answer: Key risks include: ~$40 billion annual negative free cash flow through 2027, regulatory headwinds including an antitrust trial in early 2027, tariff exposure, high beta (1.46) magnifying market downturns, and potential AI demand softening. Historical drawdowns include -94% during the Dot-Com crash.
Final Take: My Read on Amazon in 2026
Here’s the honest truth: Amazon is one of the highest-quality businesses on earth, trading at a reasonable valuation, in the middle of a massive—and risky—capital allocation cycle.
The Q1 2026 numbers were spectacular. AWS is accelerating. The custom silicon strategy is gaining real traction. The retail business is finally showing margin discipline. This is not a broken company.
But the market is asking a fair question: “Is $200 billion of annual capex too much, too fast?”
I don’t know the answer. Neither does anyone else. What I do know is that Amazon’s management has a long history of making large, multi-year bets that eventually pay off—AWS itself was once considered a crazy distraction. The difference this time is the scale. $200 billion in a single year is an order of magnitude larger than anything Amazon has attempted before.
My approach: I’m watching July 30 closely. If Q2 earnings confirm that AWS acceleration is sustainable and capex isn’t crushing margins beyond Q1’s record 13.1% print, the risk/reward tilts favorably. If guidance weakens or free cash flow deteriorates more than expected, the stock could test the $200 level again.
For long-term investors with a 3–5 year horizon, Amazon at $245 with a $312+ target and a $364 billion AWS backlog looks like a reasonable entry. For traders, wait for the Q2 print. The volatility between now and July 30 is noise—the earnings call will be signal.
Want to dive deeper? Check out our analysis on NVDA stock, TSLA stock, and Palantir stock. For broader tech exposure, see our breakdown of tech stocks in 2026 and AI infrastructure stocks. New to investing? Start with our beginners guide.